| University of Colorado at Boulder |
|
Factors that can induce earthquakes are stresses in the ground—differential and sheer—and a fault that could move under applied stresses. The stresses are high almost everywhere; even in areas with no previous seismic history, stresses are present, and in many places they are close to the failure point. Human activities such as reservoir impoundment, geothermal mines, mining, hydraulic fracturing, and fluid injection (disposal) wells can all have a major influence on these faults and could potentially cause seismic events. Defining Earthquakes
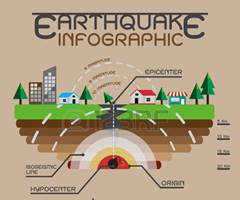
The United States Geological Survey (USGS) describes an earthquake as the result of two blocks of the earth suddenly slipping past one another. A fault, or a fault plane, is described by the USGS as the surface where the two blocks of earth slip. The location where the earthquake starts below the earth’s surface is called the hypocenter, and the location directly above the hypocenter, on the surface of the earth, is the epicenter. Another term often used for seismic activity is tectonic plates. Tectonic plates are the upper-most layer of the earth’s “skin” – they are sections of the crust and upper mantle of the earth’s surface that are slowing moving, sliding and bumping past each other. The plate boundaries are the edges of these tectonic plates, and often have many faults where earthquakes generally occur. When the faults of a particular section are sliding past one another, their rough edges often cause the plates to stick together, even though the rest of the tectonic plate is still slowly moving. As the tectonic plate moves, the faults that are stuck together build up energy. When the friction of the rough edges of the plate boundaries are overcome, the energy stored in the section is suddenly released as the fault “unsticks” and the energy vibrates as seismic waves in all direction, which causes the ground to shake in what we call an earthquake. Earthquakes happen every day, but most earthquakes cannot be felt by humans and do not effect buildings or infrastructure. Around half a million earthquakes might occur around the world every year, but only one in five can be felt. Around the world, only around 100 earthquakes cause damage annually. Measuring EarthquakesEarthquakes are measured in terms of magnitude. When energy is released at a plate boundary, the energy creates waves that ripple through the earth and along the surface layer of the earth. By measuring the amplitude of ground motion and the corresponding period of these waves, and then adjusting for the depth of the earth and the distance from the epicenter and the station measuring the earthquake, scientists can estimate the magnitude of an earthquake.
The moment magnitude scale, which starts at 0 but has no upper limit (each increase of 1.0 on the moment magnitude scale’s logarithmic scale corresponds to roughly an increase of 32 times the amount of energy released by the earthquake), is the most common measurement of earthquake magnitude today, and is more accurate in measuring larger earthquakes than the Richter scale because the moment magnitude uses more variables to calculate energy released using “seismic moment.” While the moment magnitude has largely replaced the Richter scale in most instances, the values of earthquakes when measured by either system should be similar, especially for small earthquakes. For instance, a 4.0 earthquake on the Richter scale is roughly the same as a 4.0 magnitude earthquake on the moment magnitude scale.
Induced SeismicityWhile most earthquakes are naturally-occurring, earthquakes caused by human activity are referred to as “induced seismicity.” Dam building and the subsequent reservoirs created by large dams, mining activities, geothermal systems, CO2 sequestration, and fluid injection wells can induce seismicity in areas with active or inactive faults. Most induced seismicity creates tremors or earthquakes that are small in magnitude – 4.0 or lower on the Richter scale and/or the moment magnitude scale. Beginning in 2016, the U.S. Geological Survey (USGS) produces a one‐year seismic‐hazard forecast for the central and eastern United States from induced and natural earthquakes. The report’s map is intended to provide information to the public and to facilitate the development of induced seismicity forecasting models, methods, and data. At the University of Colorado, the IS Collaboratory is currently investigating various aspects of IS including the Seismological Characteristics of IS (Researchers Anne Sheehan and Kristy Tiampo). Their research approach to determine the seismological characteristics of IS consists of two tasks. The first task includes collecting microseismic and satellite radar data at Greeley, CO, a suspected site of IS from wastewater injection to characterize the relationship between seismicity and surface deformation. Researchers are also analyzing concurrent injection and geologic information from the mitigation experiment conducted by Colorado state regulators. The second task is to characterize and distinguish the individual properties of IS and tectonic earthquakes. The objectives of this task are to (1) establish how seismicity responds to modification in injection parameters, (2) identify the seismic source characteristics of induced earthquakes and how they relate to tectonic and volcanic earthquakes, (3) distinguish the spatial, temporal, and size patterns associated with induced earthquake sequences, and (4) determine the characteristics of ground shaking generated by such events. Another team, led by Hari Rajaram, is studying the Hydromechanical Processes Controlling IS. This team, with Los Alamos National Laboratory, is attempting to improve the process of identifying high risk areas of induced earthquakes by developing high resolution hydromechanical and geomechanical models. The team is developing hydromechanical models for fluid pressure diffusion, geomechanics, and coupling between deformation and permeability evolution in the subsurface formations where seismicity is triggered. Geomechanical models of overburden deformation will quantify surface deformation from deep fluid injection. These models use fully coupled hydro-mechanical computations that capture feedback between pressure- induced deformations, alteration of stress fields, and dynamic properties of faults. Ultimately, the hydromechanical models will be used to produce representations of fluid pressure changes and surface deformation that can be compared to observations made by other Collaboratory researchers. To accomplish these goals, researchers will (1) determine the initial stress state at the research site as well as the pre-injection properties of structural features susceptible to slip, (2) identify the spatio-temporal distribution of fluid pressure increases at the site of interest, (3) distinguish the volume of rock/faults subjected to high fluid pressure, (4) and establish the surface-deformation signature associated with fluid injections. |
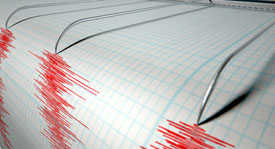 The Richter scale, created in 1935 by Charles F. Richter and measured from 0 to 10, uses a logarithm of the amplitude of waves recorded by a seismograph (an instrument that records the varying amplitude of ground oscillations from the earthquake in a zig-zag tracing motion.) While the Richter scale (also called the Local Magnitude scale (ML)), was once in wide use, seismologists now use the moment magnitude scale (Mw) to estimate the magnitude of an earthquake. Both the Richter scale and the moment magnitude scale are logarithmic scales; an increase of one unit on either scale is a ten-fold increase in earthquake amplitude. Every increase in magnitude equals about ten times as much ground shaking which is equal to over 30 times more energy released for each increase in magnitude.
 Seismic Damage